Project Description
The CALLISTO project bridges the AI with Earth Observations (EO), through specific Pilot Use Cases (PUC) such as land border, and water quality monitoring. On top of the several image processing, and use of machine learning to reveal the hidden knowledge in satellite data, CALLISTO also provides a knowledge graph of PUC datasets and provides advanced querying services. In this short blog post, we look into these layers of the project and understand how it utilizes knowledge graphs to redefine data integration and analysis.
Bridging Domains with Knowledge Graphs!
At the heart of SEMANTIC technologies of the CALLISTO project lies the CALLISTO knowledge graph of the PUC data. Each PUC, whether it’s Common Agricultural Policy (CAP) monitoring or water quality assessment, contributes valuable datasets to the project. These datasets, often in diverse formats like XML, JSON, or CSV, serve as the building blocks for a comprehensive knowledge graph. The journey towards a knowledge graph begins with ontology – the conceptual framework that models the core concepts and relationships within EO and PUCs domains. This ontology is a collaborative effort, involving domain experts to ensure a robust representation that aligns with the intricacies of the data. The ontology is available at ZENODO and Figure 1 illustrates part of the CALLISTO ontology that represents PUC1: CAP monitoring.
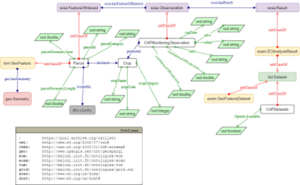
Figure 1 – PUC 1 CAP Monitoring
Data Mapping for Knowledge Graph Creation
With an approved ontology in hand, the data mapping process kicks in. This critical step involves linking datasets to ontology concepts and properties, ultimately constructing the knowledge graph. The CALLISTO knowledge graph is published at ZENODO. A synthetic generated data from CALLISTO CAP monitoring containing 2 billion triples in TTL format is published in RDF at ZENODO. The data as of 20th November 2023 has 108 views and 6 downloads.
Advanced SEMANTIC Querying
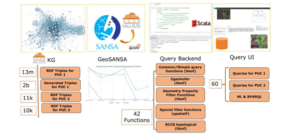
To gain insights from the knowledge graph, CALLISTO turns to SPARQL and GeoSPARQL queries. These powerful tools allow domain experts and researchers to explore the data, identify patterns, and detect integration points between EO and PUCs domains. The following figure shows the summary of created data in the knowledge graph, the number of integrated functions, and the SPARQL queries for PUC1 and PUC2.
- Example Queries
CAP monitoring: What is the distance between geo1 and geo3?

In general, the CALLISTO project showcases a technological leap as well as an advanced approach to understanding our world through Earth Observations. By embracing knowledge graphs, CALLISTO not only defines relationships within its domains but also opens the door to a broader, interconnected understanding of Earth and its dynamic systems. Stay tuned as CALLISTO continues to pave the way for a more informed and connected future.
Project Details
- DateNovember, 2023
- WriterInfAI and Fraunhofer
- 1
