Project Description
As a baseline for contributing to Common Agricultural Policy (CAP), large scale monitoring of agricultural land is important to identify the distribution of agricultural activities. In this context, our research aimed to exploit state-of-the-art deep learning techniques and develop a paddy rice classification model that produces robust early predictions throughout the growing season, to contribute in timely decision-making. The results of the research were not only the model itself but also its products (5 years of paddy rice mapping) and a ready-to-analysis dataset for training the model. These were distributed as a reference to develop other crop mapping models with expanded crop types and cultivation areas.
In South Korea, Korea Ministry of Agriculture, Food and Rural Affairs (MAFRA) produced a farm map that records various types of crop areas in a vector format, which is visually interpreted with high-resolution satellite images and aerial photos referring to the other national GIS data. However, only about one third of the country is updated on the dataset every year because of the labor-intensive and time-consuming photo interpretation process. Therefore, in this study, the farm map was used as a means for labeling data of the deep-learning model in order to achieve an effective and continuous detection of paddy rice area.
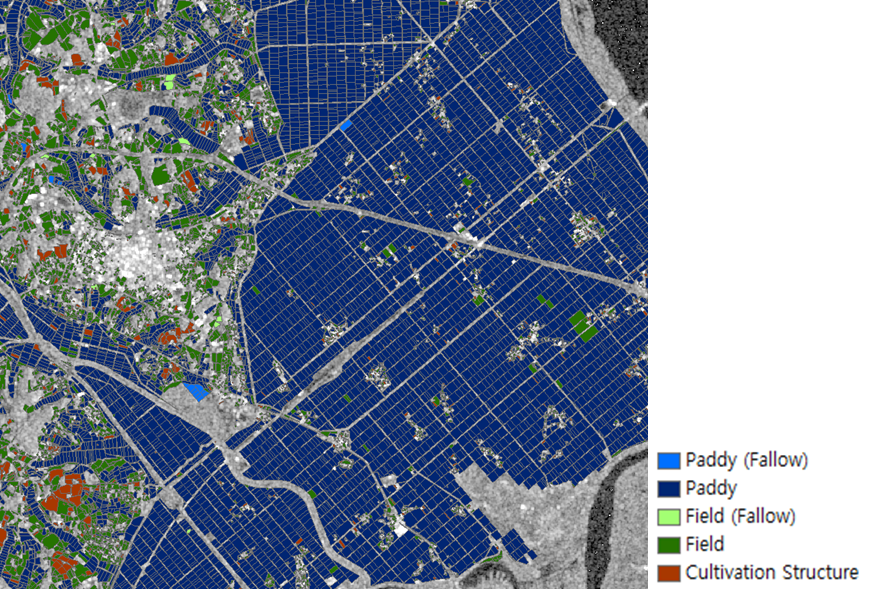
Figure 1: Farm map – a labeling source to classify paddy rice in cultivation (dark blue)
Time-series Sentinel-1 images were collected to detect paddy rice due to its advantage of data availability in any weather condition which enables early prediction of a crop area. In addition, by using a C-band SAR active sensor, Sentinel-1 is able to sensitively capture the phenological change of rice which is clearly distinguished by the inundated surface of a paddy field in planting season and coarse texture in ripening season.
In order, for the time series images to be robust invariant to the different growing phase at each region, different composite―minimum, maximum, and mean―were applied for each phenological stage. The Sentinel-1 images were separated into 7,762 patches of training data and 5,180 patches of validation data, each patch consisting of 256 x 256 pixels. The time-series data of each patch were collected in different time instances from 2017 to 2019 to coincide with that of the farm map.
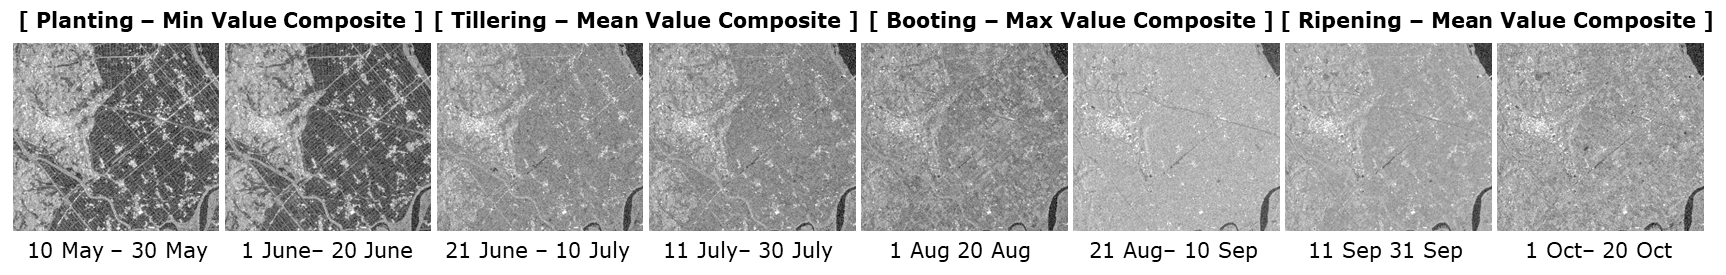 Figure 2: 8-time series of Sentinel-1 images to classify paddy rice
To perform semantic segmentation on paddy rice, a deep learning architecture was designed by integrating U-Net and RNNs layers, so it can extract both spatial and temporal features of paddy rice, monitored through time-series images. Considering both temporal feature preservation and computational efficiency, max-pooling was applied to the skip connections so that the adjacent time steps at the same phenological stage were pooled and half of the features were passed to the decoder.
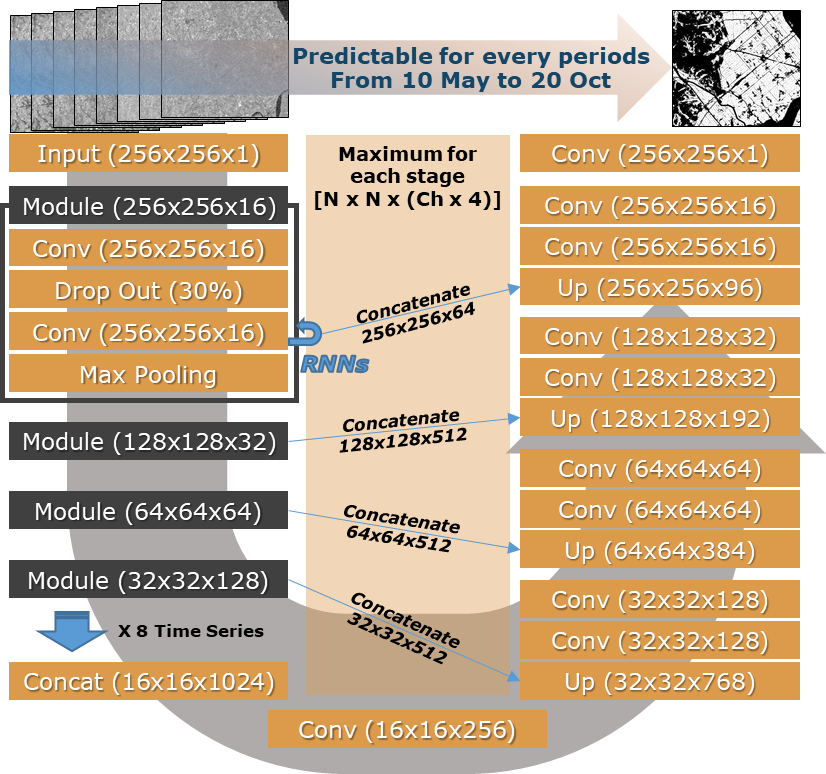
Figure 3: U-Net architecture for each time-series sharing convolutional layers (recurrent modules) at encoder
The training accuracy and Cohen’s kappa value of early prediction in May were 0.9335 and 0.5115 each and increased to 0.9675 and 0.8019 when the images were fully provided at the end of the cultivation period. The validation accuracy and Cohen’s kappa value of early prediction were 0.9315 and 0.4957 each and increased to 0.9650 and 0.7857 when the images were fully provided.
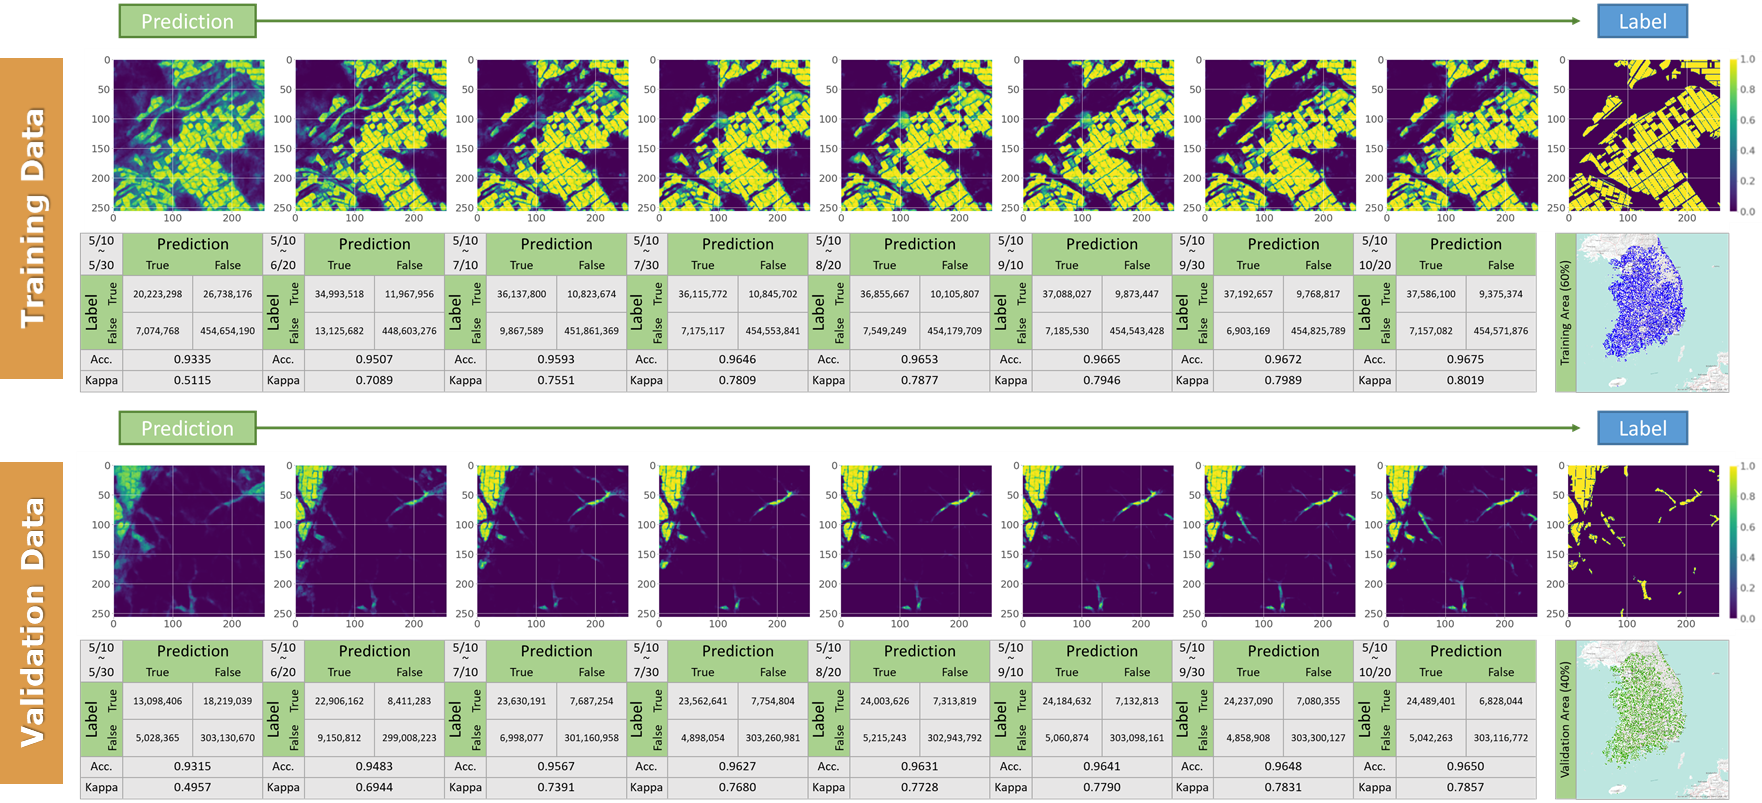
Figure 4: The validation results from the dynamic time sequence (early prediction)
The derived paddy rice map is a representative case for applying deep learning to the agricultural sector and has a great potential to be used for decision/policy-making. Along with the accompanied products (model, learning material), the dataset has a great potential to be used for developing diverse crop classification models as follows:
– Training DL models by using the 5 years of classification map as a pseudo labeling
– Baseline for developing/improving deep learning models with a reproducible dataset
– Knowledge transfer to the other crop classification tasks
– etc.
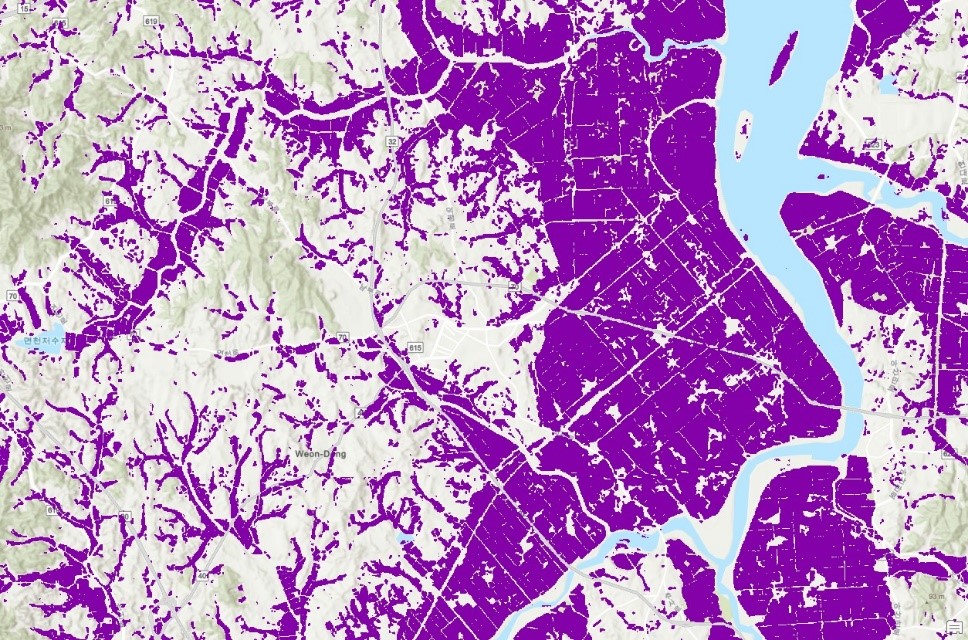
Figure 5: The result of paddy rice mapping from the deep-learning model
To further examine the general applicability of the model on the entire nation, we constructed accurate paddy rice validation data by performing additional visual interpretation on the farm map. To minimize mismatches between the validation data and the actual paddy rice distribution, 30 evaluation sites through the entire nation were selected for intensive interpretation and criteria for the classification were set based on their texture and color during the visual interpretation. The visual interpretation was performed by three interpreters and confirmed by one experienced interpreter referencing the orthographic image from Google Earth Pro, being overlapped with the farm map.
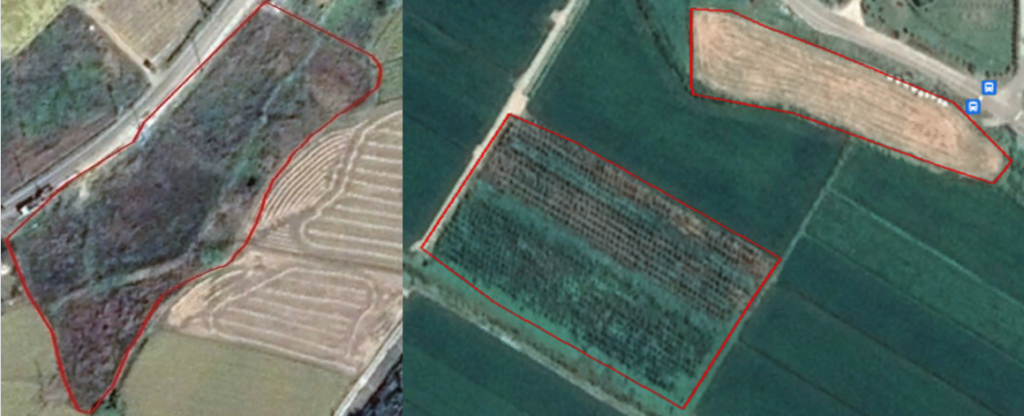
Figure 6: fallow land and untidy surfaces
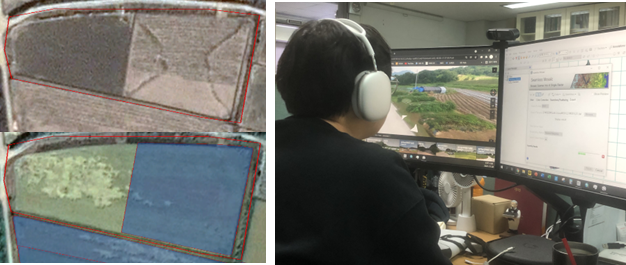
Figure 7: Correcting mismatched boundaries with the visual interpretation
In the CALLISTO project, KU provides deep learning-based paddy rice mapping algorithms. An accurate validation dataset can be accessed at the following Git-Hub pages:
Project Details
- DateJune 28, 2022
- WriterHyun-Woo Jo, Chan Woo Kim, Woo-Kyun Lee, Korea University
- 13
